NUS - ISE Business Analytics Case Competition 2023
Introduction
Beginning in 2012, the Industrial and Systems Engineering Club at the National University of Singapore has been hosting the NUS-ISE Business Analytics Case Competition annually. This competition brings together participants who are tasked with solving real-world business problems presented by industry partners. Upon receiving the case question, participants are required to quickly comprehend the issue, evaluate different scenarios and potential obstacles, and present a recommendation supported by quantitative analysis to a panel of judges within a limited time frame.
The industry partner for the NUS-ISE Business Analytics Case Competition 2023 is Micron Technology.
Disclaimer
All figures and numbers used in this competition are strictly arbitrary and used for illustration purposes only.
The team
The team consisted of the following people, all of us were from Singapore Polytechnic(SP) taking a Diploma in Electrical and Electronic Engineering(DEEE)(As of 19 February 2023)
- Khiu Kim Hong
- Ngo Bing Han
- Joshua Tan
- Zhang Xian Yang
Problem Statement
Memory is a crucial component in the technology industry, powering everything from 5G smartphones to the AI-enabled cloud. To meet the increasing demand for memory in the data economy of the future, Micron has announced plans to invest more than $150 billion in manufacturing and R&D over the next decade.
As a major supplier of DRAM and NAND memory chips, Micron Semiconductor has made significant investments in expanding its production capacity. This includes acquiring new plants, such as the Mega-fab being built in Central New York with an investment of up to $100 billion. Micron Semiconductor has also expanded its existing plants, including two expansions in Singapore and a recent announcement to expand in Idaho, United States.
In this Business Analytics Case Competition, we will focus on strategically planning locations to further increase our production capabilities.
Challenge 1
To keep up with the rising demand for semiconductors, Micron is considering the construction of a new building. Two potential proposals, highlighted below, have been put forward in line with Micron’s overall strategy. As planning engineers, we were assigned the responsibility of examining the advantages and disadvantages of each proposal.
| Proposal | Explanation |
|---|---|
| Proposal 1 | Build a new building connecting to the existing one. |
| Proposal 2 | Build a new independent building. |
Challenge 2 (a)
Micron is currently conducting a study to determine the utilization of the two proposed buildings that will be built side by side. Given the information provided below, teams are tasked with calculating the maximum throughput in a week, assuming both buildings operate for 168 hours (24 hours x 7 days) a week.
Definition of terms
| Attribute | Definition |
|---|---|
| Lot | 1 lot represents 1 unit of the product. |
| Transportation Time | The duration it takes for a lot to travel from one workstation to another. |
| Transport Across Buildings | An operation for a lot to be transported from one group of workstations to another group in a different building by truck. |
| Truck Capacity | A single truck with the ability to hold up to 5 lots. |
| Throughput | The overall quantity of lots produced in a specific time-frame. |
| Step Release | Process steps that are authorized to operate in a specific workstation group. |
 |
| Illustration of transport across buildings |
Each lot must undergo 6 steps sequentially (1 -> 2 -> 3 -> 4 -> 5 -> 6), with certain workstations being capable of specific steps. All lots will begin at Building X and, upon completion of all steps, will be available for shipment from either building. Only one lot can be processed at each workstation at any given time, and simultaneous processing of different steps is not permitted. It can be assumed that the lots are always ready to begin processing at Building X.
Transportation time within the same building is considered negligible, but cross-building transportation requires 25 minutes. At any given point in time, the truck can only be present at either one of the two buildings.
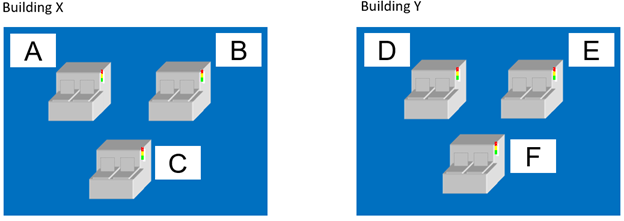
 |
| Workstation layout |
Workstation Group Step Release
| Workstation Group | Step Release |
|---|---|
| A | 1, 3 |
| B | 2, 6 |
| C | 2, 5 |
| D | 1, 4 |
| E | 1, 3, 5 |
| F | 4, 6 |
Step Process Time
| Workstation Group | STEP 1 Process Time (min) | STEP 2 Process Time (min) | STEP 3 Process Time (min) | STEP 4 Process Time (min) | STEP 5 Process Time (min) | STEP 6 Process Time (min) |
|---|---|---|---|---|---|---|
| A | 5 | 10 | ||||
| B | 15 | 10 | ||||
| C | 15 | 10 | ||||
| D | 5 | 15 | ||||
| E | 5 | 5 | 15 | |||
| F | 10 | 10 |
The following limitations are to be accounted for
- At any given time, only one lot is allowed to be present at each workstation.
- Every lot must follow the sequential order of steps 1 through 6, and skipping any step is prohibited.
- Each lot is not permitted to undergo processing at two or more workstations simultaneously.
- The truck can be present at only one building at any given time, and it takes 25 minutes to travel between the buildings, regardless of whether the truck is carrying any load.
Challenge 2 (b)
As planning engineers, the team is tasked with constructing a dashboard for data analytics and monitoring that can assist the manufacturing team in monitoring the performance of the production line. Based on the data and solutions obtained in part (a), create up to 5 essential metrics that will allow the team to track the performance of the production line.
Solution to Challenge 2 (a)
Based on the operation description and assumptions, we can have a throughput of 365 lots across both buildings in 168 hours of operations
Solution to Challenge 2 (b)
The following table shows the data metrics the team chose to focus on:
| Data Metric | Justification |
|---|---|
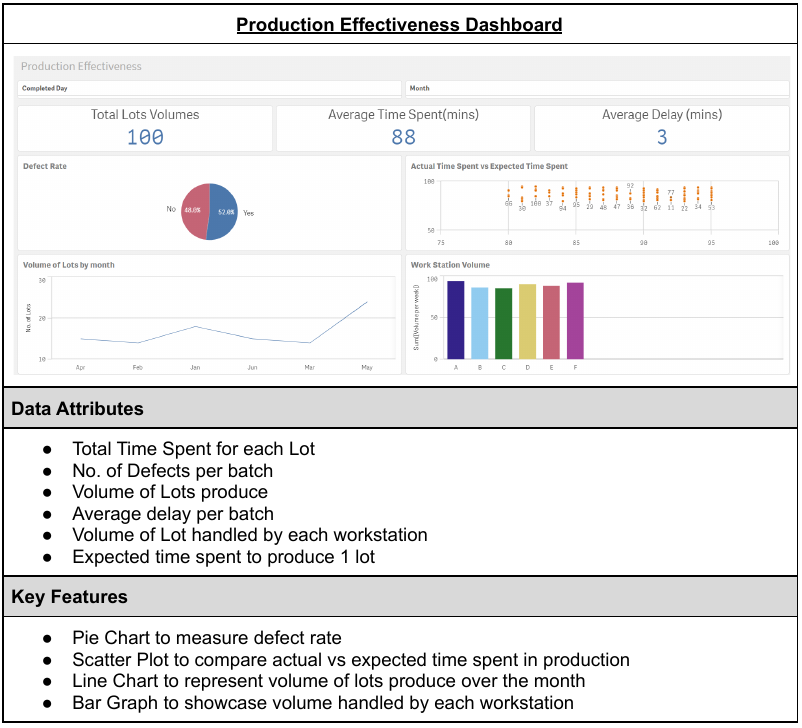
| Production Effectiveness | Illustrates the potential capabilities and attributes to measure the overall production process of 1 Lot |
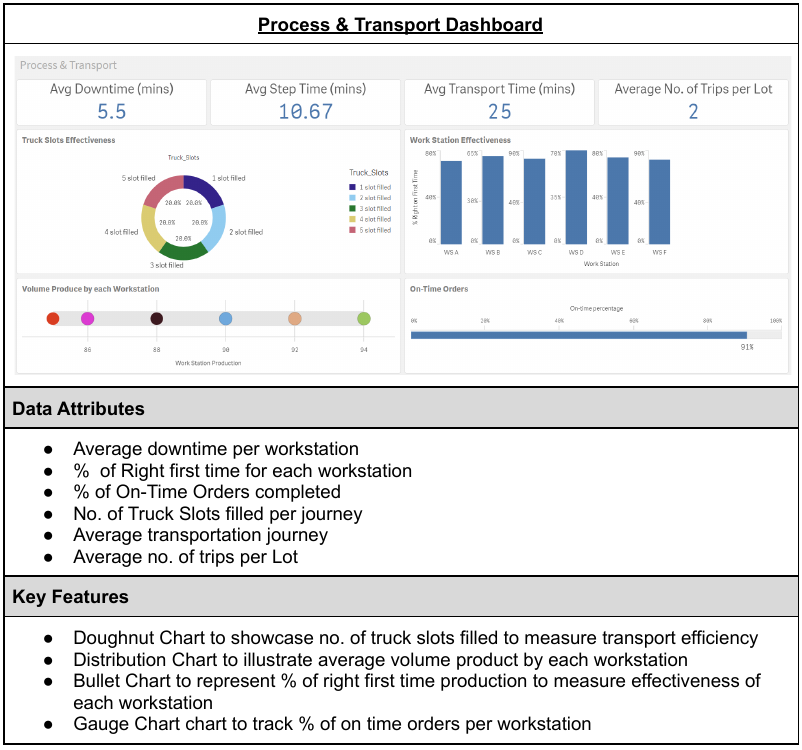
| Process Effectiveness | Measures the effectiveness of each workstation and its respective steps |
| Transport Effectiveness | Measures transport efficiency such as timing and how effective trucks slots are being utilized |
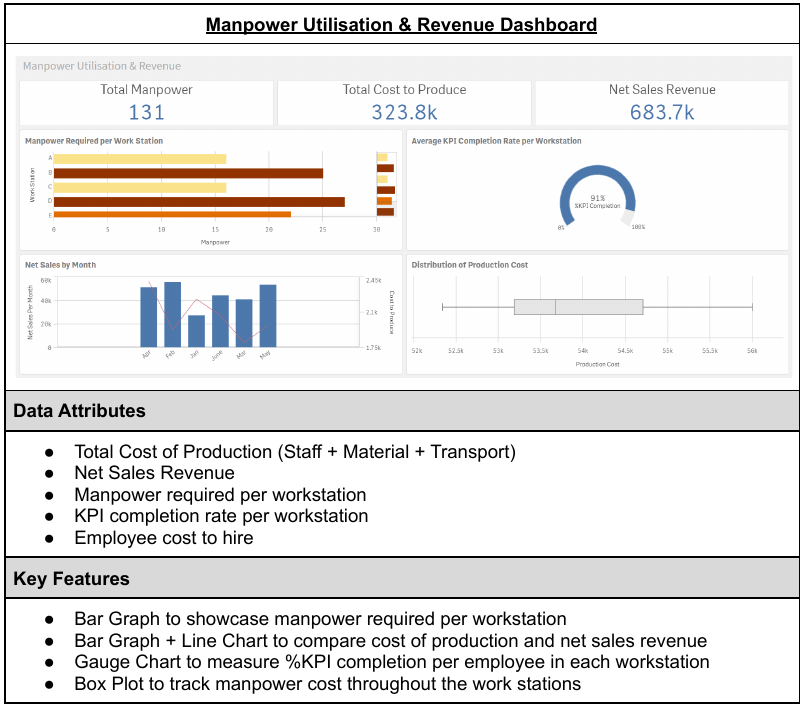
| Manpower Planning | Big picture of employee and workforce planning for each workstation |
| Cost & Revenue | Tracks the cost of production and sales revenue for analysis such as ROI, asset and turnover |
 |
| Production Effectiveness Dashboard |
 |
| Process & Transport Dashboard |
 |
| Manpower Utilisation & Revenue Dashboard |
